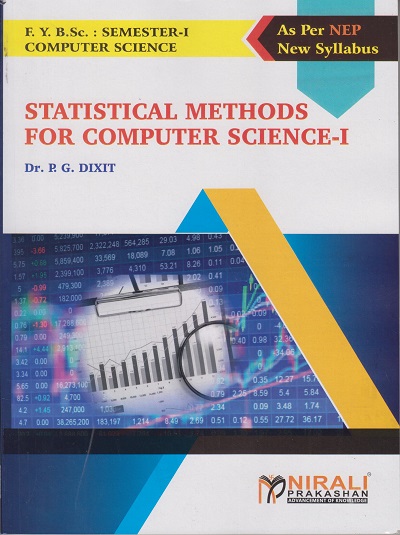
STATISTICAL METHODS FOR COMPUTER SCIENCE 1 – FY BSc Computer Science – Semester 1 | Dr P G Dixit | Nirali Prakashan

Preview Book

Authors Name Dr. P.G. Dixit
ISBN 13 9789361093029
Publisher Nirali Prakashan
Edition First
Pages 160
Language English
Publishing Year Aug-24

Email on info@pragationline.com if e-book is not found.

Estimated Delivery Time

Within Pune (1 to 2 days),
Within Maharashtra (2 to 5 days),
Outside Maharashtra (3 to 6 days) and
J&K, Ladakh and North East (5 to 8 days).

Select any one of below pricing option.
Add to Cart Go to Library Add to Cart Buy Now
download-app-scan
download-app

Description

1. Tabulation and construction of frequency distribution. (Use of at least two data sets more than 50 observations – each for constructing frequency distribution).
1.1 − 1.25
2. Diagrammatic representation of statistical data using EXCEL and data interpretation. (problems like in Paper I of SET and NET examination and other competitive examinations). (simple bar diagram, subdivided bar diagram, multiple bar diagram, percentage bar diagram, pie diagram, spike plot for Likert scale) Data interpretation from diagrams.
1.26 − 1.48
3. Graphical representation of statistical data: Histogram and frequency curve. Determination of mode graphically, Ogive curves and Pareto chart. Determination of median graphically. Data interpretation from graphs.
1.49 − 1.63
4. Summary Statistics – I: Computation of measures of central tendency for ungrouped data (AM, Median and Mode) using MS-EXCEL by regular formula method and using direct command. (Discuss use of an appropriate measure).
1.64 − 1.69
5. Summary Statistics – II: Computation of measures of central tendency for grouped data (AM, Median and Mode) using MS-EXCEL by regular formula method and by direct command. (Discuss use of an appropriate measure).
1.70 − 1.76
6. Summary Statistics – III: Computation of measures of dispersion for ungrouped data (Range, quartiles, variance, standard deviation, coefficient of variation) using MS-Excel by regular formula method and by direct command. Use of an appropriate measure and interpretation of results.
1.77 − 1.92
7. Summary Statistics – IV: Computation of measures of dispersion for grouped data (Range, quartiles, variance, standard deviation, coefficient of variation using MS-EXCEL by regular formula method and by direct command. Use of an appropriate measure and interpretation of results.
1.93 − 1.98
8. Computations of raw and central moments (not using the relation formula), measures of skewness and kurtosis (calculations in MS-EXCEL by regular formula method and by direct command, using Karl Pearson’s formula and moments). Use of an appropriate measure and interpretation of results.
1.99 − 1.113
9. Measures of Attributes (without MS-EXCEL). 1.114 − 1.130
10. Scatter diagram and computation of covariance and Karl Pearson’s correlation coefficient (calculations in MS-Excel by regular formula method and by direct command). Use of an appropriate measure and interpretation of results.
1.131 − 1.136
11. Fitting of line of regression Y = a + bX, calculations in MS-EXCEL by regular formula method and by direct command (use scatter plot for explaining the linear relationship).

Additional information
Weight 230 g
Dimensions 24 × 18 × 1 cm
Reviews (0)

Reviews

There are no reviews yet.

Be the first to review “STATISTICAL METHODS FOR COMPUTER SCIENCE 1 – FY BSc Computer Science – Semester 1 | Dr P G Dixit | Nirali Prakashan”

0
    0
    Your Cart
    Your cart is emptyReturn to Shop
      Calculate Shipping
      Apply Coupon
      STATISTICAL METHODS FOR COMPUTER SCIENCE 1 – FY BSc Computer Science – Semester 1 | Dr P G Dixit | Nirali Prakashan